| Home > Eclipses > Google Earth Gallery for Solar and Lunar Eclipses |
|
|
|||||||||||||||||||||||
|
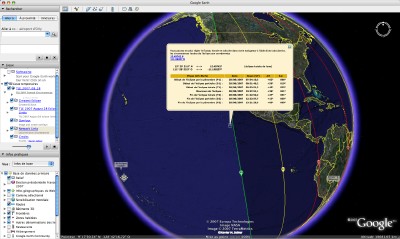
The Google Earth (available for MacOS X, Windows and Linux) files, will draw the solar and lunar eclipses maps and display their local circumstances. For solar eclipses the paths and outline curves across Earth’s surface will be drawn. And for lunar eclipses only the limit curves showing the visibility area are included. Each file containing all the eclipses over a 20-year span was made using my Five Millennium Canon of Solar Eclipses and Five Millennium Canon of Lunar Eclipses databases. These two web-enabled tools will give you access to the 11,898 solar eclipses and 12,064 lunar eclipses over the -1999 to +3000 period. |
|||||||||||||||||||||||
|
|||||||||||||||||||||||
|
|||||||||||||||||||||||
|
|
|||||||||||||||||||||||
|
|||||||||||||||||||||||
|
|||||||||||||||||||||||

Xavier M. Jubier
1999 August 11
2001 June 21
2001 December 14
2002 December 4
2003 November 23
2005 April 8
2005 October 3
2006 March 29
2006 September 22
2008 February 7
2008 August 1st
2009 January 26
2009 July 22
2010 January 15
2010 July 11
2012 May 20
2012 November 14
2013 May 10
2013 November 3
2014 April 29
2015 March 20
2016 March 9