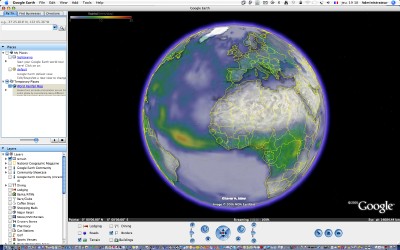
These meteorological data are used to find the best solar eclipses view sites and for my travels. Most of these maps require the use of Google Earth and are displayed as an overlay. You can then add the Google Earth solar eclipse path.
These maps (courtesy of Jay Anderson) are constructed using data acquired by the NASA Aqua satellite between 2002 and 2015. The MODIS sensor is used to establish those maps. The data in these maps have a resolution of one degree in latitude and longitude. The cloud cover values are an average of available data, from 2002 through 2015, from both daytime and nightime satellite passes. Images on this site are composed from the afternoon ascending pass of the polar-orbiting satellites and corresponds to approximately 2pm local time. MODIS collects satellite visible and infrared radiances and uses complex algorithms to automatically infer clouds and their properties around the globe. These maps should be used cautiously, as satellite-based cloud datasets have several known biases. Use them for comparative purposes, rather than as absolute values of cloudiness.
Annual world cloud cover January world cloud cover February world cloud cover March world cloud cover April world cloud cover May world cloud cover June world cloud cover July world cloud cover August world cloud cover September world cloud cover October world cloud cover November world cloud cover December world cloud cover
These maps are also available, at a resolution of 2.5° in latitude and longitude, from July 1982 through 2001 with the International Satellite Cloud Climatology Project established in 1982 as a part of the World Climate Research Program.
Annual world cloud cover January world cloud cover February world cloud cover March world cloud cover April world cloud cover May world cloud cover June world cloud cover July world cloud cover August world cloud cover September world cloud cover October world cloud cover November world cloud cover December world cloud cover
Loading each monthly overlay in Google Earth may take a few seconds. Please be patient.
World Land Temperature
Land surface temperature is a good indicator of the energy balance at the Earth’s surface, and serves as an important indicator of the greenhouse effect. Land surface temperature is the sum of all the comings and goings of energy between the ground and the atmosphere, and as such, it can reveal quite a bit about surface conditions. Land surface temperature is how hot the "surface" of the Earth would feel to the touch in a particular location. Thus, land surface temperature is not the same as the air temperature that is included in the daily weather report. Temperatures range from -25 degrees Celsius (deep blue) to 45 degrees Celsius (pinkish yellow). The Moderate Resolution Imaging Spectroradiometer (MODIS) on NASA’s Terra and Aqua satellites record the temperature of every square kilometer of the Earth nearly every day, barring cloudy skies. The maps show the daytime surface temperature for every month from January 2006 to December 2008.
In addition to their role as rain- and snow-makers in Earth’s water cycle, clouds play a major part in Earth’s energy budget — the balance of energy that enters and leaves the climate system. Clouds may have a warming or cooling influence depending on their altitude, type, and when they form. Clouds reflect sunlight back into space, which causes cooling. But they can also absorb heat that radiates from the Earth’s surface, preventing it from freely escaping to space. These maps show what fraction of an area was cloudy on average each month. The measurements were collected by the Moderate Resolution Imaging Spectroradiometer (MODIS) sensor on NASA’s Terra satellite. Colors range from blue (no clouds) to white (totally cloudy). The maps are available for every month from January 2006 to December 2010.
Researchers estimate precipitation across the entire globe by considering many different kinds of input data. Rain gauges are the most accurate, but limited to populated land areas. A variety of satellites provide complete global coverage, but they present two major challenges: first, the various satellite sensors only observe quantities related to precipitation, and algorithms must be developed to get the best estimate from each particular sensor. Second, the mix of available data is constantly changing in space and time, forcing researchers to cope with the particular reliabilities and biases at each time/space grid box. The precipitation data set is computed in the NASA/GSFC Laboratory for Atmospheres as a contribution to the GPCP, an international research project of the World Meteorological Organization’s Global Energy and Water Exchange program. Detailed information and a variety of precipitation products and images are available at http://precip.gsfc.nasa.gov/. The rainfall maps show the total monthly rainfall in millimeters as recorded by NASA’s Tropical Rainfall Measuring Mission (TRMM) satellite, which is a joint mission between NASA and the Japanese Space Agency. High rain totals are represented in red, while small rainfall totals are shown in white. TRMM measures rainfall in the tropics. High-latitude regions, where TRMM does not record rainfall, are white. The maps are available for every month from January 2006 to December 2008.
Scientists use data from the Moderate Resolution Imaging Spectroradiometer (MODIS) sensor on NASA’s Terra satellite to measure the relative amount of aerosols — solid or liquid particles suspended in the atmosphere. Examples of such aerosols include dust, sea salts, volcanic ash, and smoke. This false-color image is a map of where there are aerosols that reflect visible and near infrared radiation. Dark brown pixels show high aerosol concentrations, while tan pixels show lower aerosol concentrations, and light blue regions indicate little or no aerosol. White indicates regions where no data are available. The MODIS aerosol optical depth product is a measure of how much light airborne particles prevent from passing through a column of atmosphere. Aerosols tend to absorb or reflect incoming sunlight, thus reducing visibility and increasing optical depth. An optical depth of less than 0.1 (palest yellow) indicates a crystal clear sky with maximum visibility, whereas a value of 1.0 (reddish brown) indicates very hazy conditions. Every day over the entire planet, MODIS measures the amount of visible and infrared light that is absorbed within the atmosphere and how much is reflected back up into space. The image represents the average aerosol optical depth over the Earth for the month indicated. The maps are available for every month from January 2006 to December 2008.
Scientists use data from NASA’s Total Ozone Mapping Spectrometer (TOMS) to measure the relative amount of aerosols — solid or liquid particles suspended in the atmosphere. Aerosol types detected by the TOMS Aerosol Index include desert dust, smoke and volcanic ash located at least 2 km (1.2 miles) above the surface. Every day, TOMS measures how much UV radiation is absorbed within the atmosphere and how much is reflected back up into space. These measures directly relate to how much aerosol is concentrated within a particular column of atmosphere. Over time, these daily data are combined into a series of 1-month false-color global composite images. Brown pixels represent high aerosol concentrations, yellow pixels show lower aerosol concentrations, and light blue regions indicate little or no aerosol present above 2 km in altitude. The Aerosol Index is particularly useful for tracking dust and smoke over bright surfaces, such as deserts or snow- and ice-covered surfaces where other satellite techniques become unreliable. The TOMS Aerosol Index also has the unique capability of seeing smoke and dust when they are above or in the presence of some clouds (visit the TOMS Web site for more details). The maps are available for every month from January 2000 to July 2005.
NASA’s Total Ozone Mapping Spectrometer (TOMS) provides measurements that enable scientists to accurately estimate how much of the sun’s UV-B (290 to 320 nm) radiation reaches the Earth’s surface. Too much exposure to these wavelengths causes sunburn in human skin. The false-color image is a global map, averaged from TOMS snapshots collected every day over a one-month period, showing where more or less UV radiation reaches the surface. Yellow pixels show the highest levels of radiation at the surface, red and pink hues are intermediate values, and white indicates little or no UV exposure. The TOMS sensor flies in a polar orbit, crossing the equator every day at 12 noon local time, allowing it to measure the total amount of ozone in a column of atmosphere as well as cloud cover over the entire globe. Ozone and clouds absorb most of the ultraviolet light passing through the atmosphere. TOMS also measures the amount of solar radiation escaping from the top of the atmosphere. It is the combination of those three measurements that enables scientists to accurately estimate the amount of UV radiation that reaches the Earth’s surface. The maps are available for every month from January 2000 to July 2004 (data courtesy TOMS science team, NASA Goddard Space Flight Center).
;)
;)
;)
;)
;)
;)
;)
;)
;)
;)
;)
;)
;)